Performance monitoring for ProCall Enterprise UCServer
June 2022
If required, it may be necessary to monitor the operation of the estos ProCall Enterprise server with regard to a wide variety of features on the Microsoft Windows operating system and also to collect the recorded performance indicators over a longer period of time.
The Performance monitoring included in the Microsoft Windows operating system, also known as Windows Performance Monitor, is suitable for this purpose.
To avoid having to search for and individually compile the large number of possible performance indicators, a template for the data collector set is available in the form of an XML file that can be easily imported so that the data collectors and their indicators can then be adapted to the respective requirements of the environment to be monitored.
Step by step guide
Download XML file – template estos UCServer data collector set
The template of the estos UCServer data collector set for Microsoft Windows performance monitoring is available for download here.

Please place this XML file on the estos ProCall Enterprise server to be monitored in a suitable (temporary) storage location.
Creating the data collector set
Start the Microsoft Performance Monitor app on the estos ProCall Enterprise server to be monitored. On operating systems in English, the app can be found under the title Performance Monitor.
In the context menu of the user-defined data collector sets is select the menu item New – Data collector Set:
Example screenshot: Performance Monitor – Performance – Data Collector Sets – User defined – Create a new Data Collector Set

In the next step, select a name for the data collector set to be created, enter the name (in the example here estos UCServer) and select the Create from a template option (recommended).

In the next dialog, select the template provided by estos via browser window using Browse...:
Example screenshot: Select template (Template)
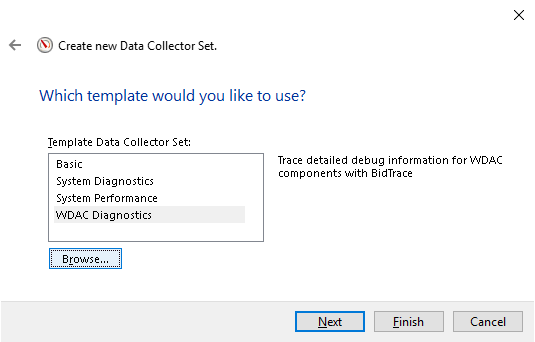
Once the estos UCServer.xml template has been selected from the location, the next dialog shows the estos UCServer template in the list of available templates. Select this template and confirm the selection:

For a new data collector set, the default output directory is the path %systemdrive%\PerfLogs\Admin\<name of data collector set>. However, this output path can be customized if necessary.
In the example shown, the output files are written to a PerfLogs subfolder of the estos UCServer standard log directory:
Example screenshot: Define output folder – Browse For Folder – PerfLogs subfolder

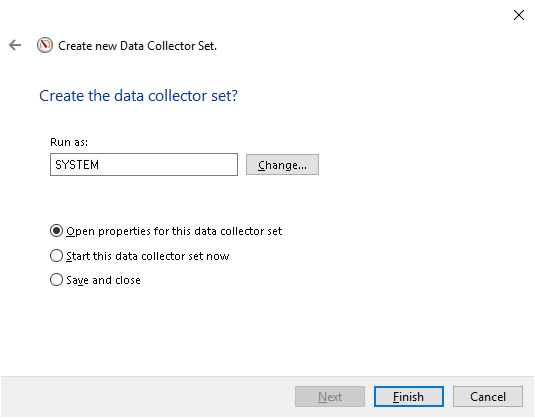
The next step is to specify the security context in which the data collector set is to be operated. The estos UCServer data collector set is usually to be operated in the SYSTEM context, but depending on the individual security settings in the operating system, it may also be necessary to select a different security principle under Run as:.
Select the Open properties for this data collector set option. Via Finish, the data collector record is now created:
Example screenshot: Create new Data Collector Set – Open properties...
The properties of the data collector set are now displayed and can be customized:

Data collector selection
The created data collector set (here estos UCServer) contains a total of seven data collectors:
Example screenshot: Performance Monitor with created data collector set UCServer and data collectors

The distribution of the performance indicators among these seven data collectors was chosen in order to selectively remove indicators for estos services from the collection that are not operated on the respective host when the estos ProCall Enterprise server components are distributed among more than one host.
However, it may also make sense to delete data collectors from the default, for example, based on the specific software deployment or analysis task. For example, if it is a pure CTI installation in the TAPI environment without the use of SIP softphones or lines and A/V chat, the monitoring of the estos UC media server service will not be necessary and the data collectors EUCMediaServer and uc-media-server related to this service can be removed.
Overview of data collectors and purpose of use for UCServer services and processes
| Data collector | Intended use/monitored components | Notes |
|---|---|---|
EUCHostData | Process-independent and host-specific performance indicators | |
UCServer | estos UCServer operations | *1 |
EUCSrv | estos UCServer service | *1 |
EUCWeb | estos UC web server service (process EUCWeb.exe) | *1 |
node | estos UC Web Server process (node.exe process) | *1 |
EUCMediaServer | estos UC MediaServer service (process EUCMediaServer.exe) | *2 |
uc-media-server | estos UC MediaServer process (process uc-media-server.exe) | *2 |
In an estos ProCall Enterprise rule installation, all server services and processes are run on the same host, so the seven data collectors can all be relevant.
However, if the estos UC media server service is operated remotely on a separate host, data collectors can be removed on the respective host:
*1 - Data collectors for the estos UCServer and estos UC web server host; the data collectors marked with *2 in the notes column in the table above can be deleted,
*2 - Data collectors for the estos UC media server host: the data collectors marked with *1 in the notes column in the table above can be deleted.
Customization of the data collectors
The data collectors are designed for a general need. They contain performance indicators of fundamental interest when recording operating conditions of the estos ProCall Enterprise server. A list of the performance indicators contained in the template can be found in section 6.
However, depending on the task to be analyzed, performance indicators may be omitted or may be additionally relevant or interesting.
All data collectors are preset with a data collection frequency of 1/min (sampling interval) and the data are saved in binary format (protocol format binary) (*.BLG). Also preset are the protocol file names (these correspond to the data collector names), the activated option prefix computer name to file and the attached protocol mode. Of course, these specifications can also be adapted to the specific task or infrastructure as required.
Customization of the data collector EUCHostData
The EUCHostData data collector includes performance indicators that are not directly related to estos ProCall Enterprise processes. These include, for example, processor utilization, free hard disk or main memory, or network activities.
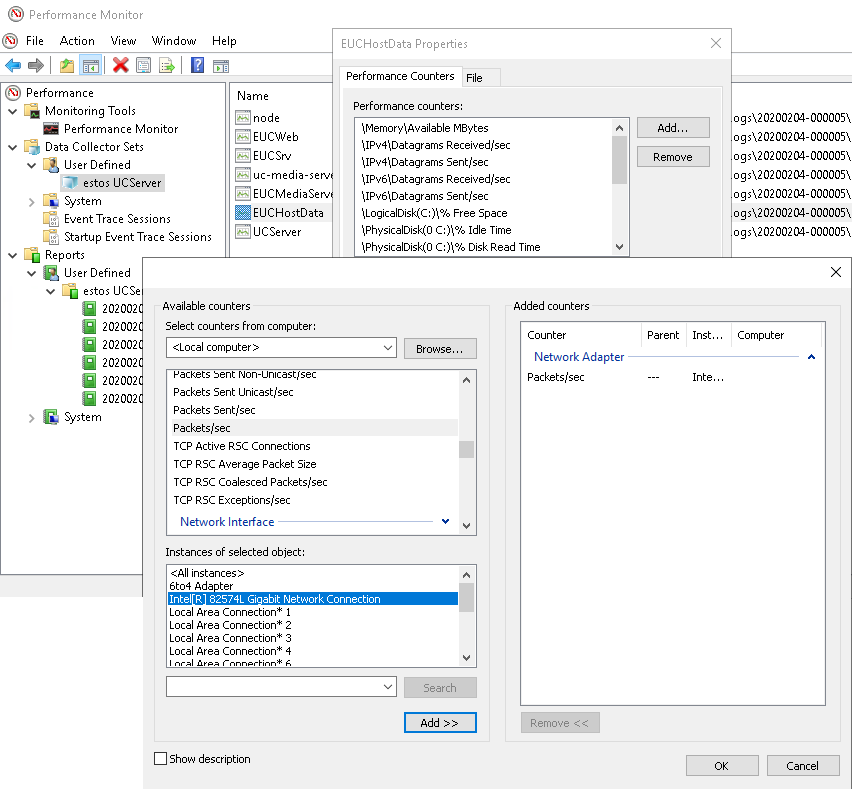
In detail, the template contains a performance indicator Packets/s related to the object Network Adapter to be monitored. Since this indicator differs from host to host with regard to the instance related to the concrete network adapter, this indicator – insofar as this performance indicator is actually of interest – must be added manually under selection of the concrete network adapter and the original unsuitable template indicator must be removed:
Example screenshots: Performance Monitor – Customization data collector
Data collector set operation
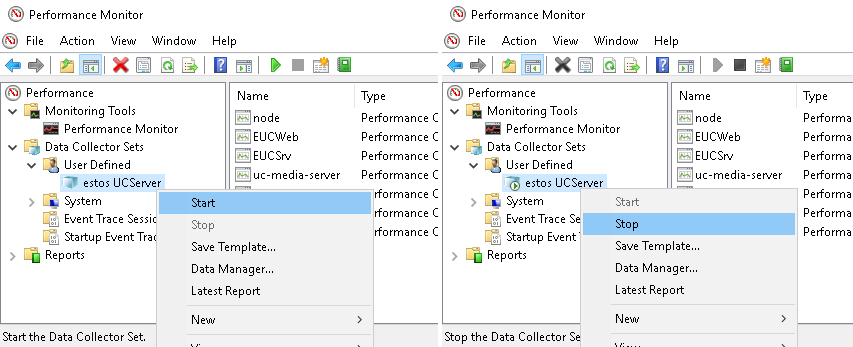
Once all settings for the data collector set or for the respective data collectors have been verified or customized, data collection can be started and also stopped via the same context menu:
Example screenshot: Performance Monitor – start/stop data collection
The files with the acquired data sets can be found in the subdirectories of the selected location:
Example screenshot: Performance Monitor – Data collection – Call location

These files are not completely written and closed until the data collection set is stopped, so that only then can they be passed on for analysis or opened in the link standard directly with the Performance Monitoring app for viewing.
Collection of further system information
If the analysis material collected by means of performance monitoring is to be passed on in the context of a support case, it is usually also useful to collect and transmit the machine data by means of Microsoft Windows app system information (msinfo32.exe, on English operating systems Microsoft Windows app system information) for the comprehensive recording of the host system to be evaluated.
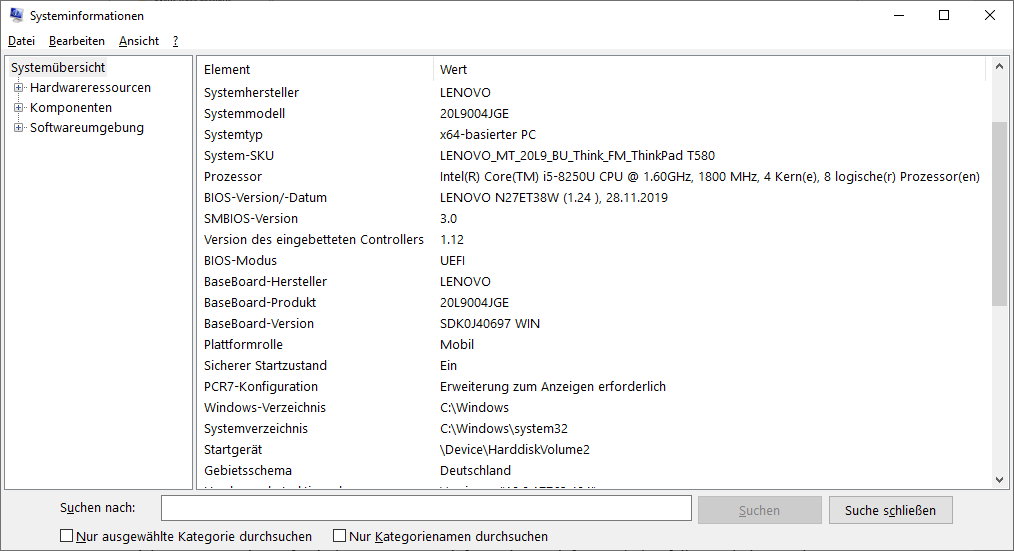
Save the system information of the host to be examined is to be saved by means of the app as *.NFO file (menu item File – Save...) or to be exported directly as text file (menu item File – Export...). This information source particularly provides detailed information about the CPU type used, the number of processors and the number of cores. Furthermore, it contains information about error reports collected by the Windows Error Reporting WER.
List of performance indicators
The performance indicators viewable under Details are contained in the data collector template estos UCServer.xml:
Data collector
Object | Instance | Performance indicator |
|---|---|---|
Memory | - | Available MBytes |
IPv4 | - | Datagrams Received/sec |
IPv4 | - | Datagrams Sent/sec |
IPv6 | - | Datagrams Received/sec |
IPv6 | - | Datagrams Sent/sec |
LogicalDisk | C: | % Free Space |
Network Adapter | ThinkPad Thunderbolt 3 Dock USB Ethernet | Packets/sec |
PhysicalDisk | (0 C:) | % Idle Time |
PhysicalDisk | (0 C:) | % Disk Read Time |
PhysicalDisk | (0 C:) | % Disk Write Time |
UDPv4 | - | Datagrams Received/sec |
UDPv4 | - | Datagrams Sent/sec |
UDPv6 | - | Datagrams Received/sec |
UDPv6 | - | Datagrams Sent/sec |
Processor | _Total | % Idle Time |
Processor | _Total | % Processor Time |
System | - | Processor Queue Length |
Object | Instance | Performance indicator |
|---|---|---|
UCServer | - | * (All indicators) |
Object | Instance | Performance indicator |
|---|---|---|
Process | EUCSrv | % Privileged Time |
Process | EUCSrv | % Processor Time |
Process | EUCSrv | % User Time |
Process | EUCSrv | Elapsed Time |
Process | EUCSrv | Handle Count |
Process | EUCSrv | ID Process |
Process | EUCSrv | IO Data Bytes/sec |
Process | EUCSrv | IO Data Operations/sec |
Process | EUCSrv | IO Other Bytes/sec |
Process | EUCSrv | IO Other Operations/sec |
Process | EUCSrv | IO Read Bytes/sec |
Process | EUCSrv | IO Read Operations/sec |
Process | EUCSrv | IO Write Bytes/sec |
Process | EUCSrv | IO Write Operations/sec |
Process | EUCSrv | Page Faults/sec |
Process | EUCSrv | Page File Bytes |
Process | EUCSrv | Page File Bytes Peak |
Process | EUCSrv | Pool Non-paged Bytes |
Process | EUCSrv | Pool Paged Bytes |
Process | EUCSrv | Priority Base |
Process | EUCSrv | Private Bytes |
Process | EUCSrv | Thread Count |
Process | EUCSrv | Virtual Bytes |
Process | EUCSrv | Virtual Bytes Peak |
Process | EUCSrv | Working Set |
Process | EUCSrv | Working Set – Private |
Process | EUCSrv | Working Set Peak |
Object | Instance | Performance indicator |
|---|---|---|
Process | EUCWeb | % Privileged Time |
Process | EUCWeb | % Processor Time |
Process | EUCWeb | % User Time |
Process | EUCWeb | Elapsed Time |
Process | EUCWeb | Handle Count |
Process | EUCWeb | ID Process |
Process | EUCWeb | IO Data Bytes/sec |
Process | EUCWeb | IO Data Operations/sec |
Process | EUCWeb | IO Other Bytes/sec |
Process | EUCWeb | IO Other Operations/sec |
Process | EUCWeb | IO Read Bytes/sec |
Process | EUCWeb | IO Read Operations/sec |
Process | EUCWeb | IO Write Bytes/sec |
Process | EUCWeb | IO Write Operations/sec |
Process | EUCWeb | Page Faults/sec |
Process | EUCWeb | Page File Bytes |
Process | EUCWeb | Page File Bytes Peak |
Process | EUCWeb | Pool Nonpaged Bytes |
Process | EUCWeb | Pool Paged Bytes |
Process | EUCWeb | Priority Base |
Process | EUCWeb | Private Bytes |
Process | EUCWeb | Thread Count |
Process | EUCWeb | Virtual Bytes |
Process | EUCWeb | Virtual Bytes Peak |
Process | EUCWeb | Working Set |
Process | EUCWeb | Working Set – Private |
Process | EUCWeb | Working Set Peak |
Object | Instance | Performance indicator |
|---|---|---|
Process | node | % Privileged Time |
Process | node | % Processor Time |
Process | node | % User Time |
Process | node | Elapsed Time |
Process | node | Handle Count |
Process | node | ID Process |
Process | node | IO Data Bytes/sec |
Process | node | IO Data Operations/sec |
Process | node | IO Other Bytes/sec |
Process | node | IO Other Operations/sec |
Process | node | IO Read Bytes/sec |
Process | node | IO Read Operations/sec |
Process | node | IO Write Bytes/sec |
Process | node | IO Write Operations/sec |
Process | node | Page Faults/sec |
Process | node | Page File Bytes |
Process | node | Page File Bytes Peak |
Process | node | Pool Non-paged Bytes |
Process | node | Pool Paged Bytes |
Process | node | Priority Base |
Process | node | Private Bytes |
Process | node | Thread Count |
Process | node | Virtual Bytes |
Process | node | Virtual Bytes Peak |
Process | node | Working Set |
Process | node | Working Set – Private |
Process | node | Working Set Peak |
Object | Instance | Performance indicator |
|---|---|---|
Process | EUCMediaServer | % Privileged Time |
Process | EUCMediaServer | % Processor Time |
Process | EUCMediaServer | % User Time |
Process | EUCMediaServer | Elapsed Time |
Process | EUCMediaServer | Handle Count |
Process | EUCMediaServer | ID Process |
Process | EUCMediaServer | IO Data Bytes/sec |
Process | EUCMediaServer | IO Data Operations/sec |
Process | EUCMediaServer | IO Other Bytes/sec |
Process | EUCMediaServer | IO Other Operations/sec |
Process | EUCMediaServer | IO Read Bytes/sec |
Process | EUCMediaServer | IO Read Operations/sec |
Process | EUCMediaServer | IO Write Bytes/sec |
Process | EUCMediaServer | IO Write Operations/sec |
Process | EUCMediaServer | Page Faults/sec |
Process | EUCMediaServer | Page File Bytes |
Process | EUCMediaServer | Page File Bytes Peak |
Process | EUCMediaServer | Pool Non-paged Bytes |
Process | EUCMediaServer | Pool Paged Bytes |
Process | EUCMediaServer | Priority Base |
Process | EUCMediaServer | Private Bytes |
Process | EUCMediaServer | Thread Count |
Process | EUCMediaServer | Virtual Bytes |
Process | EUCMediaServer | Virtual Bytes Peak |
Process | EUCMediaServer | Working Set |
Process | EUCMediaServer | Working Set – Private |
Process | EUCMediaServer | Working Set Peak |
Object | Instance | Performance indicator |
|---|---|---|
Process | uc-media-server | % Privileged Time |
Process | uc-media-server | % Processor Time |
Process | uc-media-server | % User Time |
Process | uc-media-server | Elapsed Time |
Process | uc-media-server | Handle Count |
Process | uc-media-server | ID Process |
Process | uc-media-server | IO Data Bytes/sec |
Process | uc-media-server | IO Data Operations/sec |
Process | uc-media-server | IO Other Bytes/sec |
Process | uc-media-server | IO Other Operations/sec |
Process | uc-media-server | IO Read Bytes/sec |
Process | uc-media-server | IO Read Operations/sec |
Process | uc-media-server | IO Write Bytes/sec |
Process | uc-media-server | IO Write Operations/sec |
Process | uc-media-server | Page Faults/sec |
Process | uc-media-server | Page File Bytes |
Process | uc-media-server | Page File Bytes Peak |
Process | uc-media-server | Pool Non-paged Bytes |
Process | uc-media-server | Pool Paged Bytes |
Process | uc-media-server | Priority Base |
Process | uc-media-server | Private Bytes |
Process | uc-media-server | Thread Count |
Process | uc-media-server | Virtual Bytes |
Process | uc-media-server | Virtual Bytes Peak |
Process | uc-media-server | Working Set |
Process | uc-media-server | Working Set – Private |
Process | uc-media-server | Working Set Peak |