State of knowledge

December 2025

ProCall Analytics


This article explains how you can create a so-called debug log from ProCall Analytics and make it available for analysis.

Log files can only be examined if meaningful anchor points are available. Therefore, always provide the following additional information

    • Workflow sequence that led to an error or unexpected result.

    • When did this unexpected result or behaviour occur (timestamp with date and time, at least to the nearest minute)?

    • Which query criteria were selected?

    • Do the problems occur with specific queries about projects, agents, groups, time periods, etc.?

    • Are there any installation, configuration or operating problems? How do these manifest themselves?

Procedure

ProCall Analytics Administration

Open the  administration interface of ProCall Analytics.

Example screenshot: Procall Analytics Server Administration – Diagnostics

Select the Diagnostics tab.

  1. Set the log level to Log with debug information.
  2. Once you have reproduced the problem or the incident to be reported has occurred again, use the button Create problem report to create the log files as a zip folder on your desktop:

    Example screenshot: Procall Analytics Server Administration – Log level, debug information – Create problem report


Notes on log levels

The following log levels are available for selection:

  • Log errors only
  • Log errors and warnings
  • Log errors, warnings and information
  • Logging with debug information
  • Logging with extended debugging

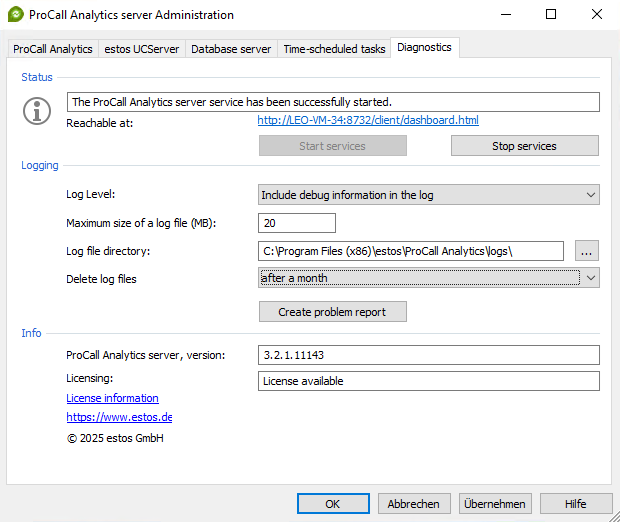
The log level should only be set to "Log with extended debugging" when requested by support.
Extended debugging generates very large log files and thus puts a load on the system.
Therefore the log level should be reset by selecting "Log with extended debugging" as soon as you have generated the log files completely!

Further information