Various types of analyses can be carried out in this menu, based on users, groups, various time settings, etc.
Export line utilisation data
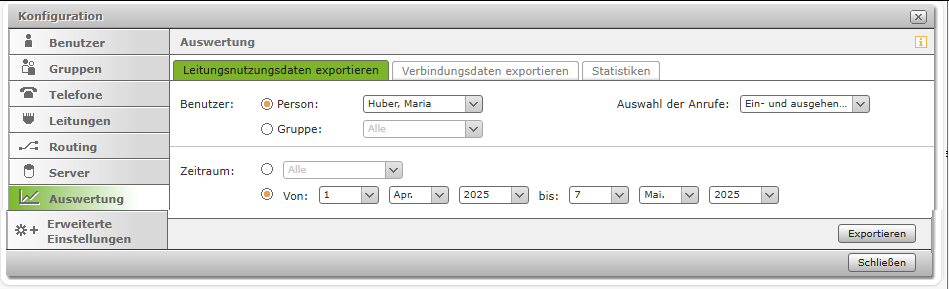
In this tab, several drop-down fields can be used to specify which connection data is exported for a user or group. You can also set time periods for the data to be exported.
Example screenshot - Configuration - Evaluation - Export line utilisation data
The connection data is output as a CSV file with the name "output.csv". The structure of the output file is described in the appendix.
Export connection data
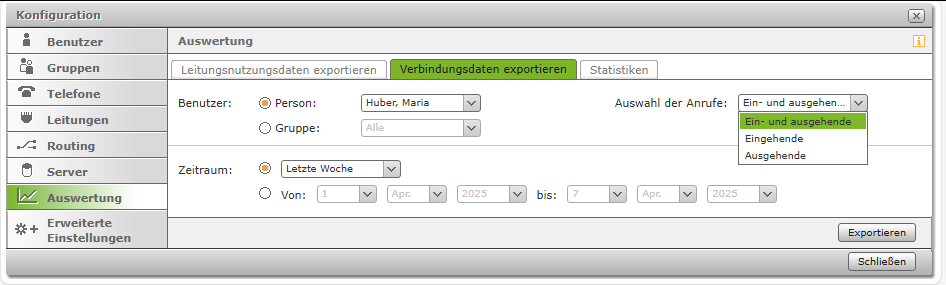
In this tab, several setting options can be used to specify which connection data is exported. You can also set time periods for the data to be exported.
Example screenshot - Configuration - Evaluation - Export connection data
The connection data is output as a CSV file with the name "output.csv". The structure of the output file isdescribed in the appendix.
Statistics
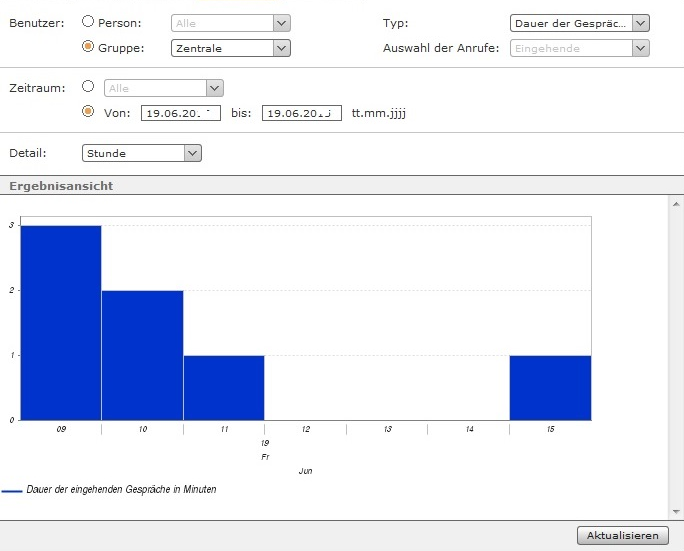
In this tab, it is possible to display graphical representations of the connection data. Here too, there are several checkboxes and drop-down menus to influence which data is displayed.
Example screenshot: Results view - graphical representation of the connection data